Walkthrough
One plan, from empty to answered
This is the whole program in the order you would actually use it: describe a household, read what the engine makes of it, change one thing, then hand the optimization over. Every screen below is the sample plan that ships with the app — Bob, 60, retiring in Nevada — so you can follow along with the same numbers.
On this page
The app opens on a sample retirement plan for a fictitious person Bob, not on a blank page. Bob's plan is what you get on first run — accounts, a house, a mortgage and a planned sale already filled in — because an empty form tells you nothing about what the program does, while a finished one shows you every screen with something in it. There is no empty template, and File ▸ New gives you this same sample again.
So the real first step is to make it yours: work through the Input topics replacing Bob's figures with your own, then Save As… under your own name. Everything below is that first walk through the screens.
Two stages, no Compute button. Everything you tell the plan lives in Input. Everything the engine makes of it lives in the Workbench. There is nothing to press in between: change a number on one and the other has already changed, which is what makes it worth trying a figure you are unsure about.
1 · Who the plan covers
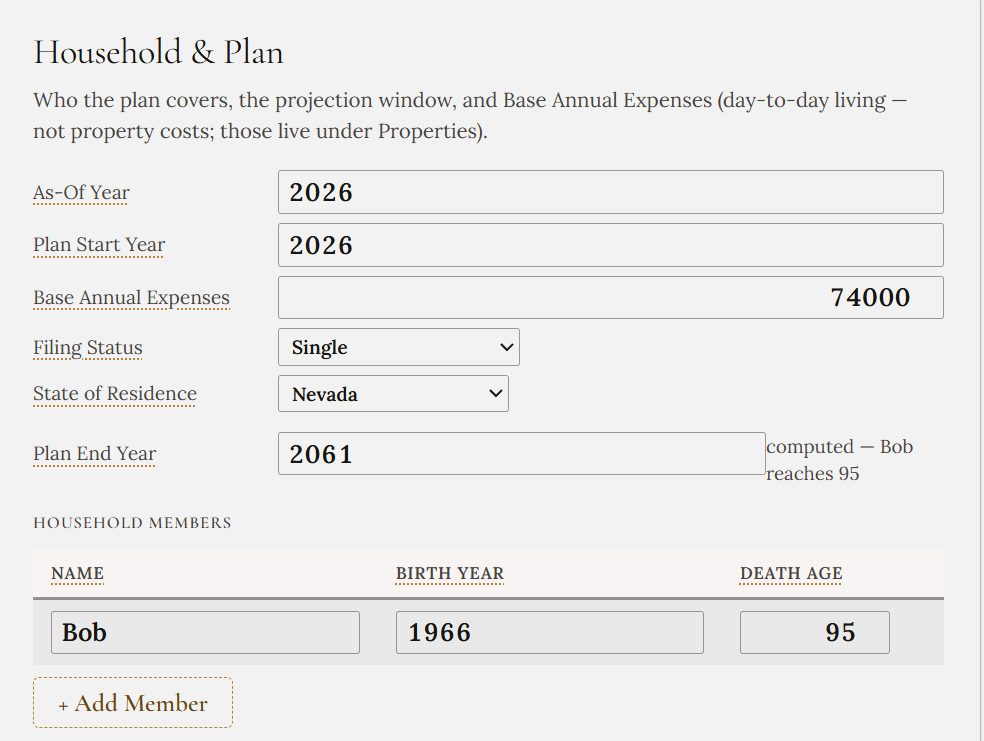
A projection needs to know who is in the household, when they were born, how long to run, and what ordinary life costs. Bob is 60, files Single, and lives in Nevada. The plan runs to 2061 — and that end year is computed, not typed: it is the year the longest-lived member reaches the age you gave them.
Base Annual Expenses is day-to-day living only — food, travel, insurance that is not on a property. It deliberately excludes anything you pay because you own a house. Those belong to the property, so that selling the house actually stops paying them.
2 · What you own
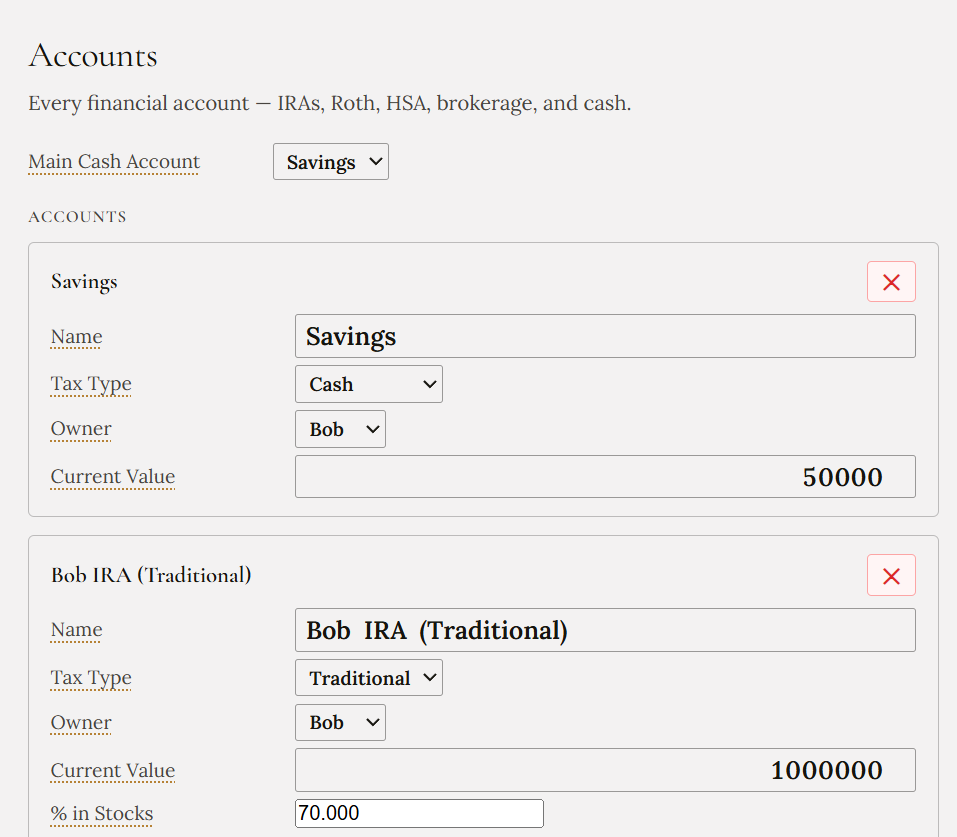
Every account carries a tax type, and that single field drives most of what makes retirement planning interesting. A traditional IRA is taxed as ordinary income on the way out and forces withdrawals in your seventies. A Roth is tax-free with no forced withdrawals. A brokerage account is taxed only on its gains, at capital-gains rates. An HSA is the best treatment available and is kept out of everyday spending entirely.
Each investment account also states its own % in stocks. That share earns the equity return, the rest earns the fixed-income return, and the same share decides how hard a market crash lands on that account — so a conservative account and an aggressive one behave differently all the way through, not only in a bad year.
3 · The house
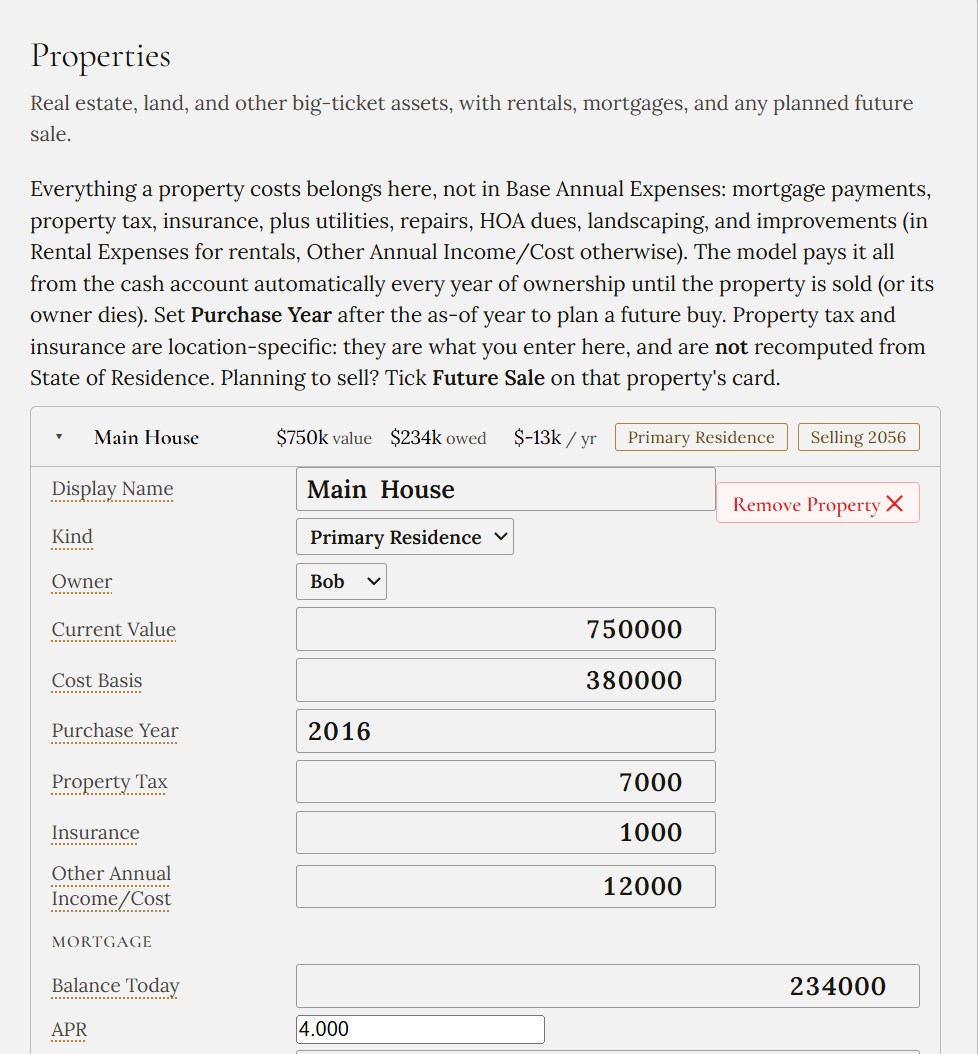
A property is not a line on a net-worth chart. It costs money every year it is owned — mortgage, property tax, insurance, and everything else — and the model pays all of it from cash automatically until the property is sold or its owner dies. Property tax and insurance are what you enter, not something recomputed from your state: changing where you live for income-tax purposes does not change what the county assessor charges on a house you already own.
Marking one Primary Residence earns it the home-sale exclusion — $250,000 of gain single, $500,000 filing jointly, fixed in law since 1997 and never indexed. The exclusion is applied at the sale rather than later at tax time, which is most of what it is worth: the excluded gain never enters your income at all, so it cannot drag you over the ACA subsidy cliff or into a higher Medicare tier two years afterwards. Selling also asks what you will pay in rent from then on, because a plan where you sell the house and live nowhere is not a plan.
4 · Social Security and health cover
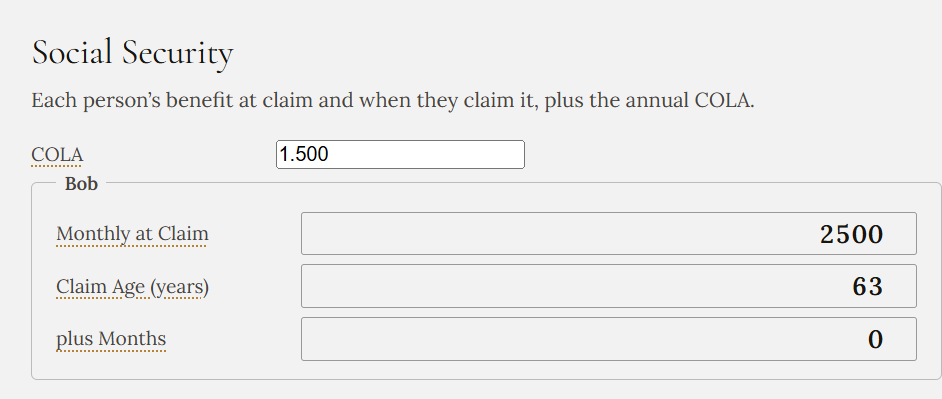
Social Security is entered as a claiming age rather than a year, because that is the actual decision: claim early for a permanently smaller check, or wait for a larger one. If you claim before Full Retirement Age while still working, the earnings test withholds part of the benefit — and the plan models the half most tools forget, where those withheld months are credited back permanently at Full Retirement Age.
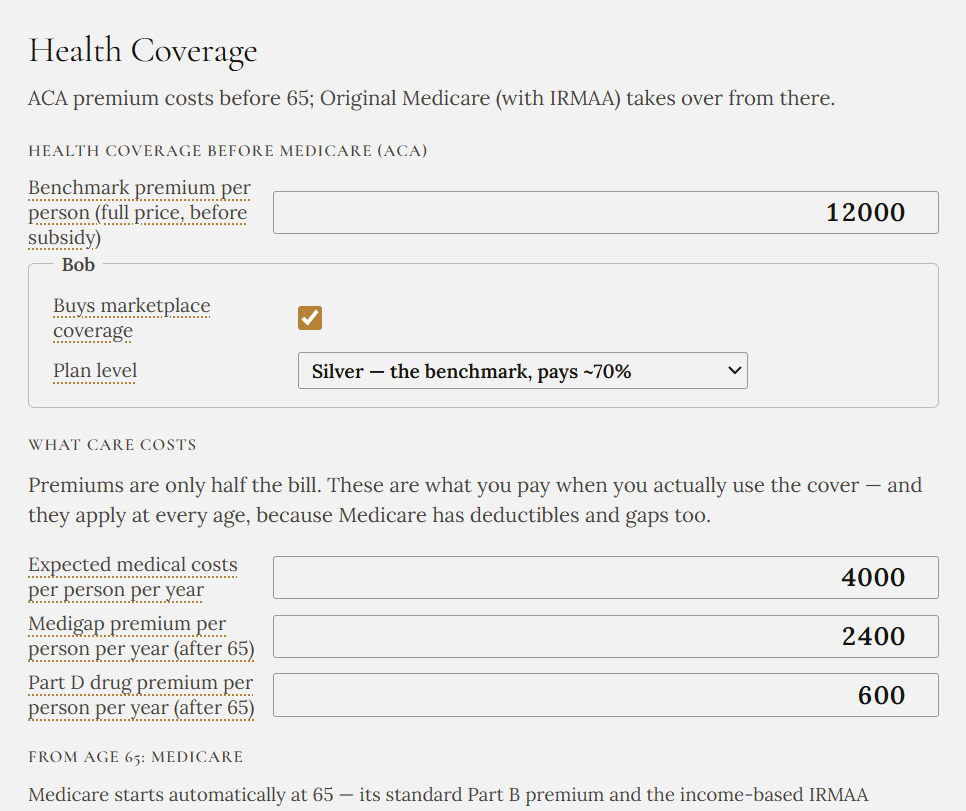
Health cover changes shape at 65, and both sides of that line are modeled. Before 65 you are on a marketplace plan, where the credit slides with income and then stops dead above four times the Federal Poverty Level. That cliff is real current law, and a large Roth conversion in your early sixties can walk you straight over it. From 65, Medicare takes over with its income-based IRMAA surcharge on a two-year lookback — which is why a conversion has to think two years ahead, not just about this April.
Premiums are only half the bill. What you spend actually using the cover is modeled at every age, not just before 65 — otherwise healthcare would appear to go free the day you turn 65, a cliff landing exactly where the hardest trade-offs live.
5 · What you plan to do
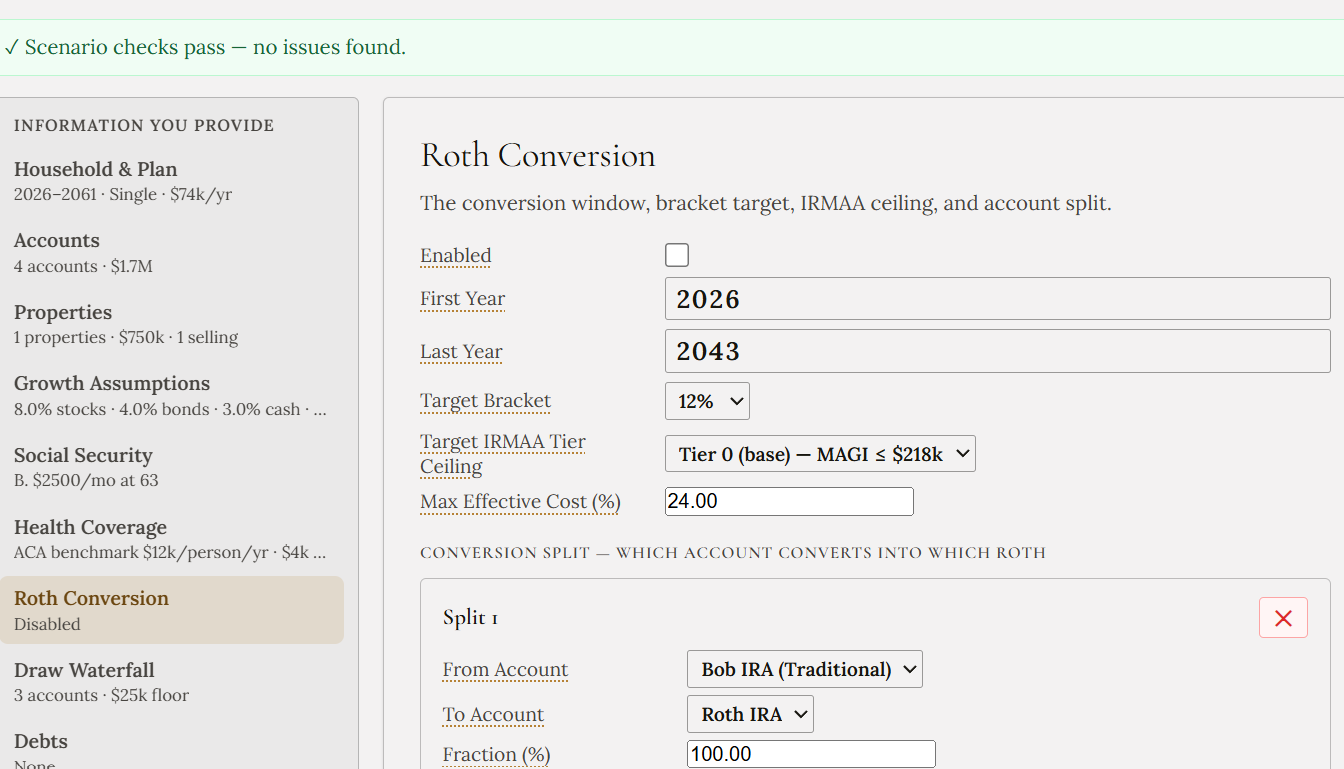
Rather than asking you to guess a conversion amount for each of twenty years, the plan takes a policy: a window, and a bracket to fill up to. Each year it converts exactly enough to reach the top of that bracket and no further. Two guards make it safe to leave running: a ceiling that stops conversions crossing into a higher Medicare tier, and a cap on the all-in cost of a converted dollar — which counts the lost ACA subsidy and the capital gains pushed out of the 0% band, not just the headline rate.
In the sample it is switched off, and everything else about it is filled in. That is deliberate: it leaves the single largest improvement in this plan undiscovered, so there is something real for the optimizer to find later on. Notice the sidebar summary saying Disabled — the app is consistent about telling you what is and is not running.
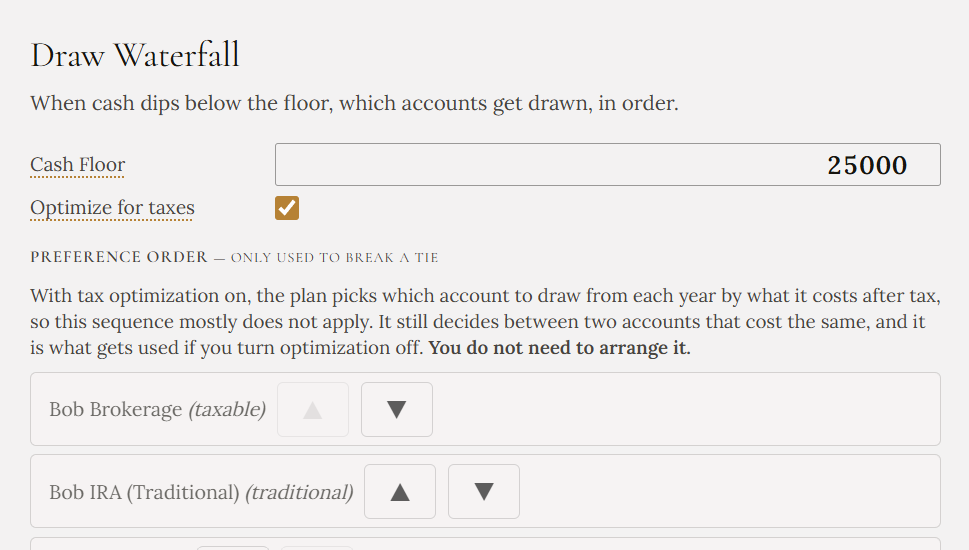
The draw waterfall decides where a year's spending comes from once cash falls below its floor. With tax optimization on, the plan looks ahead before taking money out of a pre-tax account: if any of your investment gains still fall in the 0% capital-gains band, it takes those first. That band resets every year and cannot be saved up, and a strict drain order almost never reaches it.
6 · The answer, in sentences
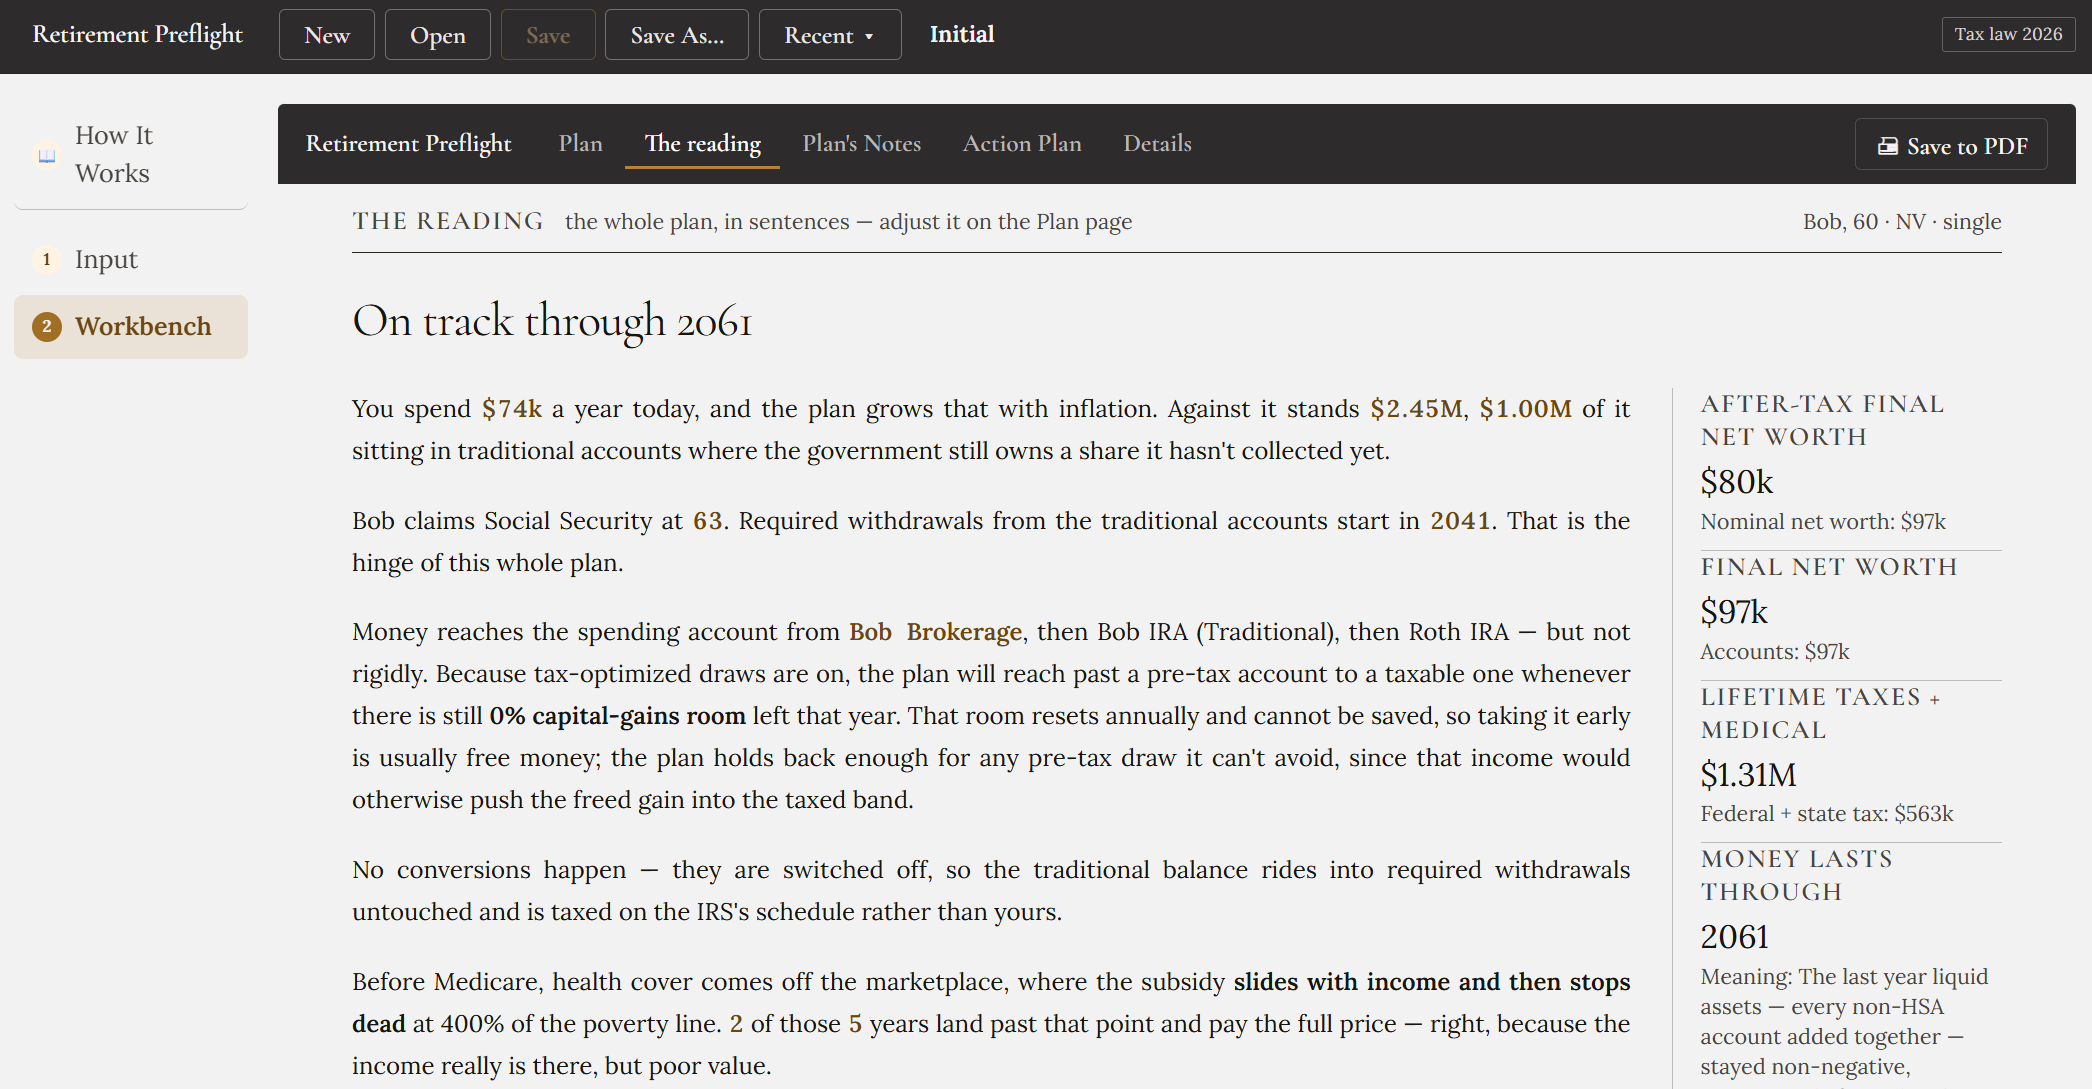
That is the whole input, and the Workbench has been keeping up the entire time — there is no Compute step. It opens with a verdict in one line (does this plan last, and what is left at the end) over four headline figures. The honest one is After-Tax Final Net Worth, which subtracts the tax still owed on traditional balances, because a dollar in a traditional IRA is not worth a dollar in a Roth.
Charts are good at shape and bad at reasons, so the same live plan is also written out as prose — and the important figures are editable inside the sentences, so you can change the story by rewriting it.
One sentence in it is the hinge of this whole tour: “No conversions happen — they are switched off, so the traditional balance rides into required withdrawals untouched and is taxed on the IRS's schedule rather than yours.” The plan works. It lasts to 2061. It is also leaving something on the table, and it says so without being asked.
7 · What to do this year
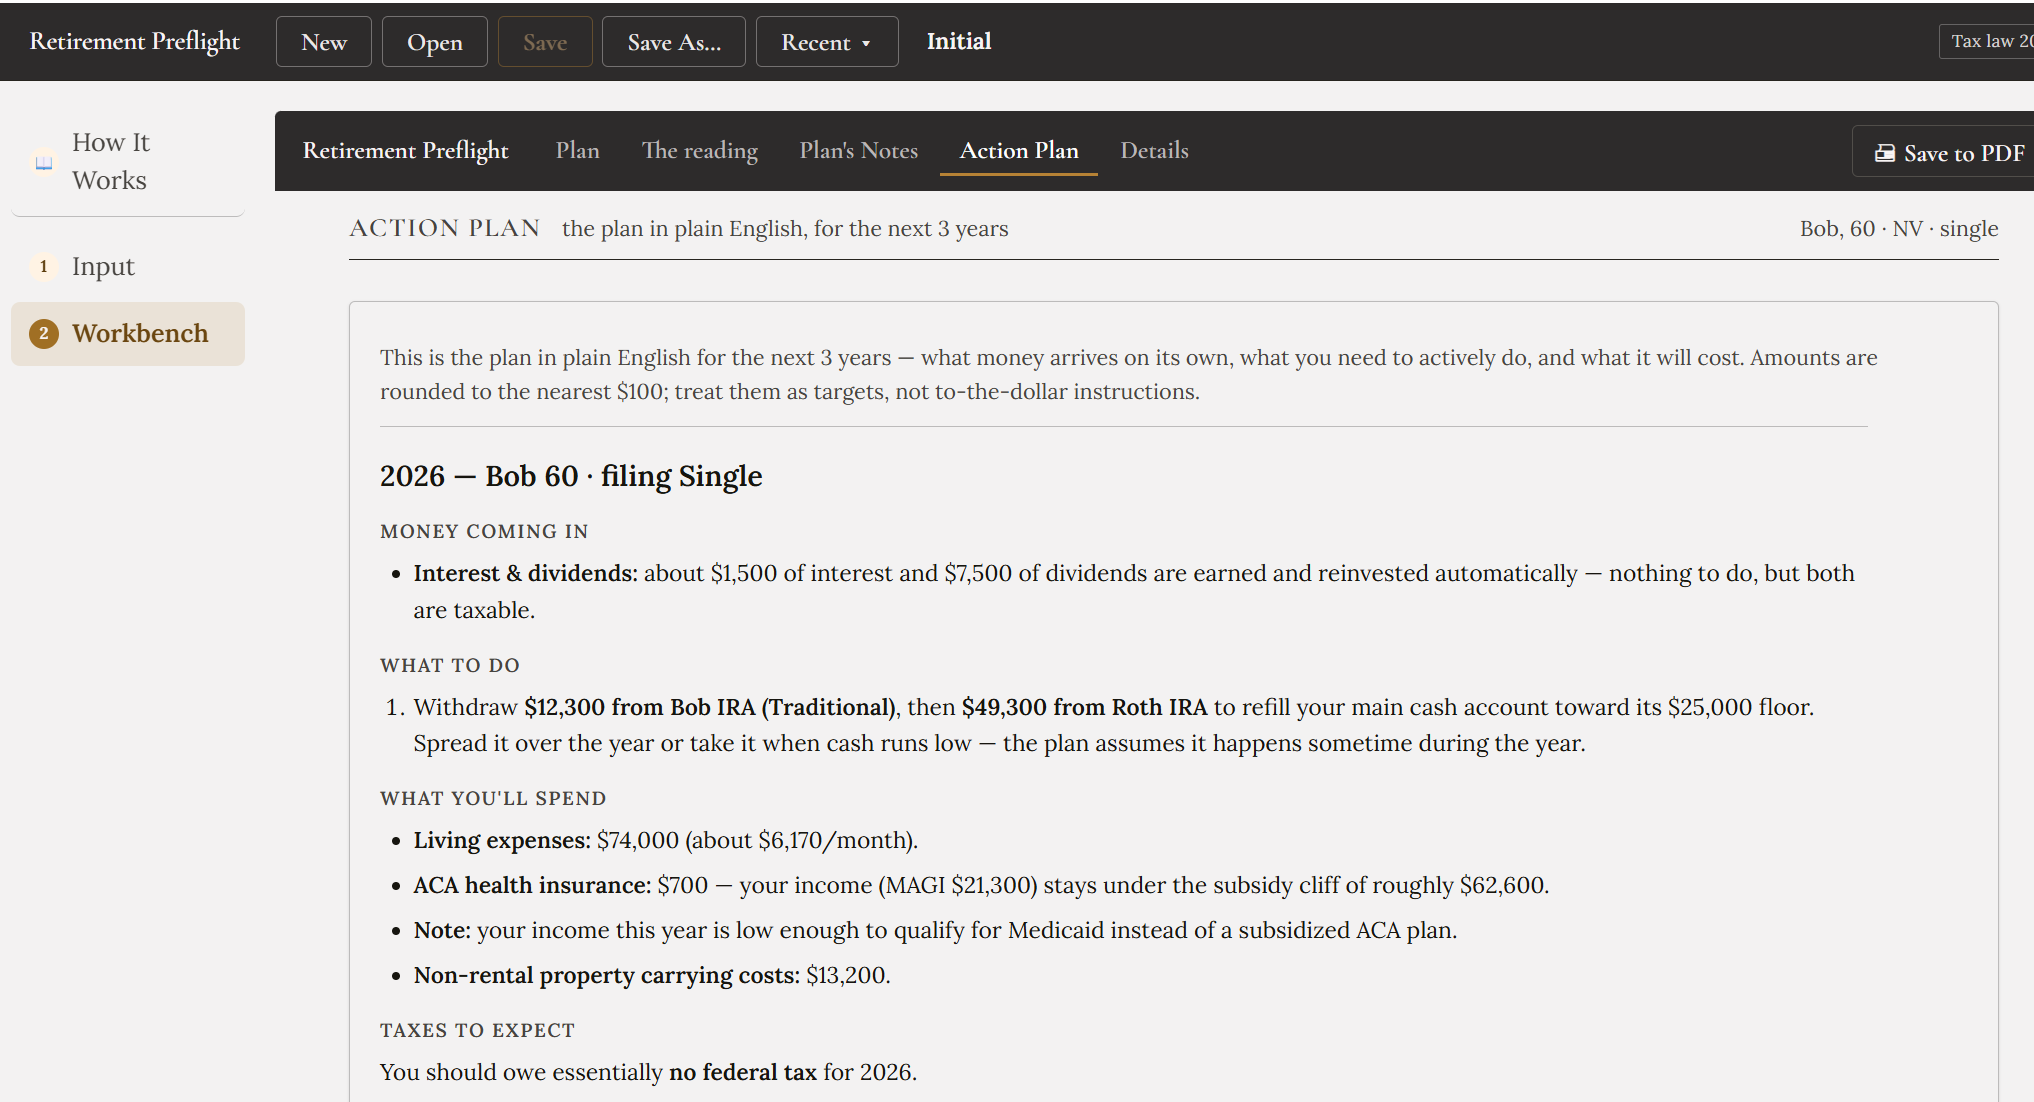
This is the page the rest of the program exists to produce. Not a chart, not a balance — a list of what to actually do, in plain English, with the arithmetic already done and the reasoning attached to each instruction.
Read this one closely, because it contains the whole argument for what comes next. Bob withdraws enough to cover the year, spends $74,000, and owes essentially no federal tax — his income is so low he would qualify for Medicaid. That sounds like good news. It is actually a standing loss: a whole year of the cheapest tax brackets there will ever be, going completely unused, while a million dollars sits in a traditional IRA waiting to be taxed later at whatever rate applies then.
8 · Every year, in full
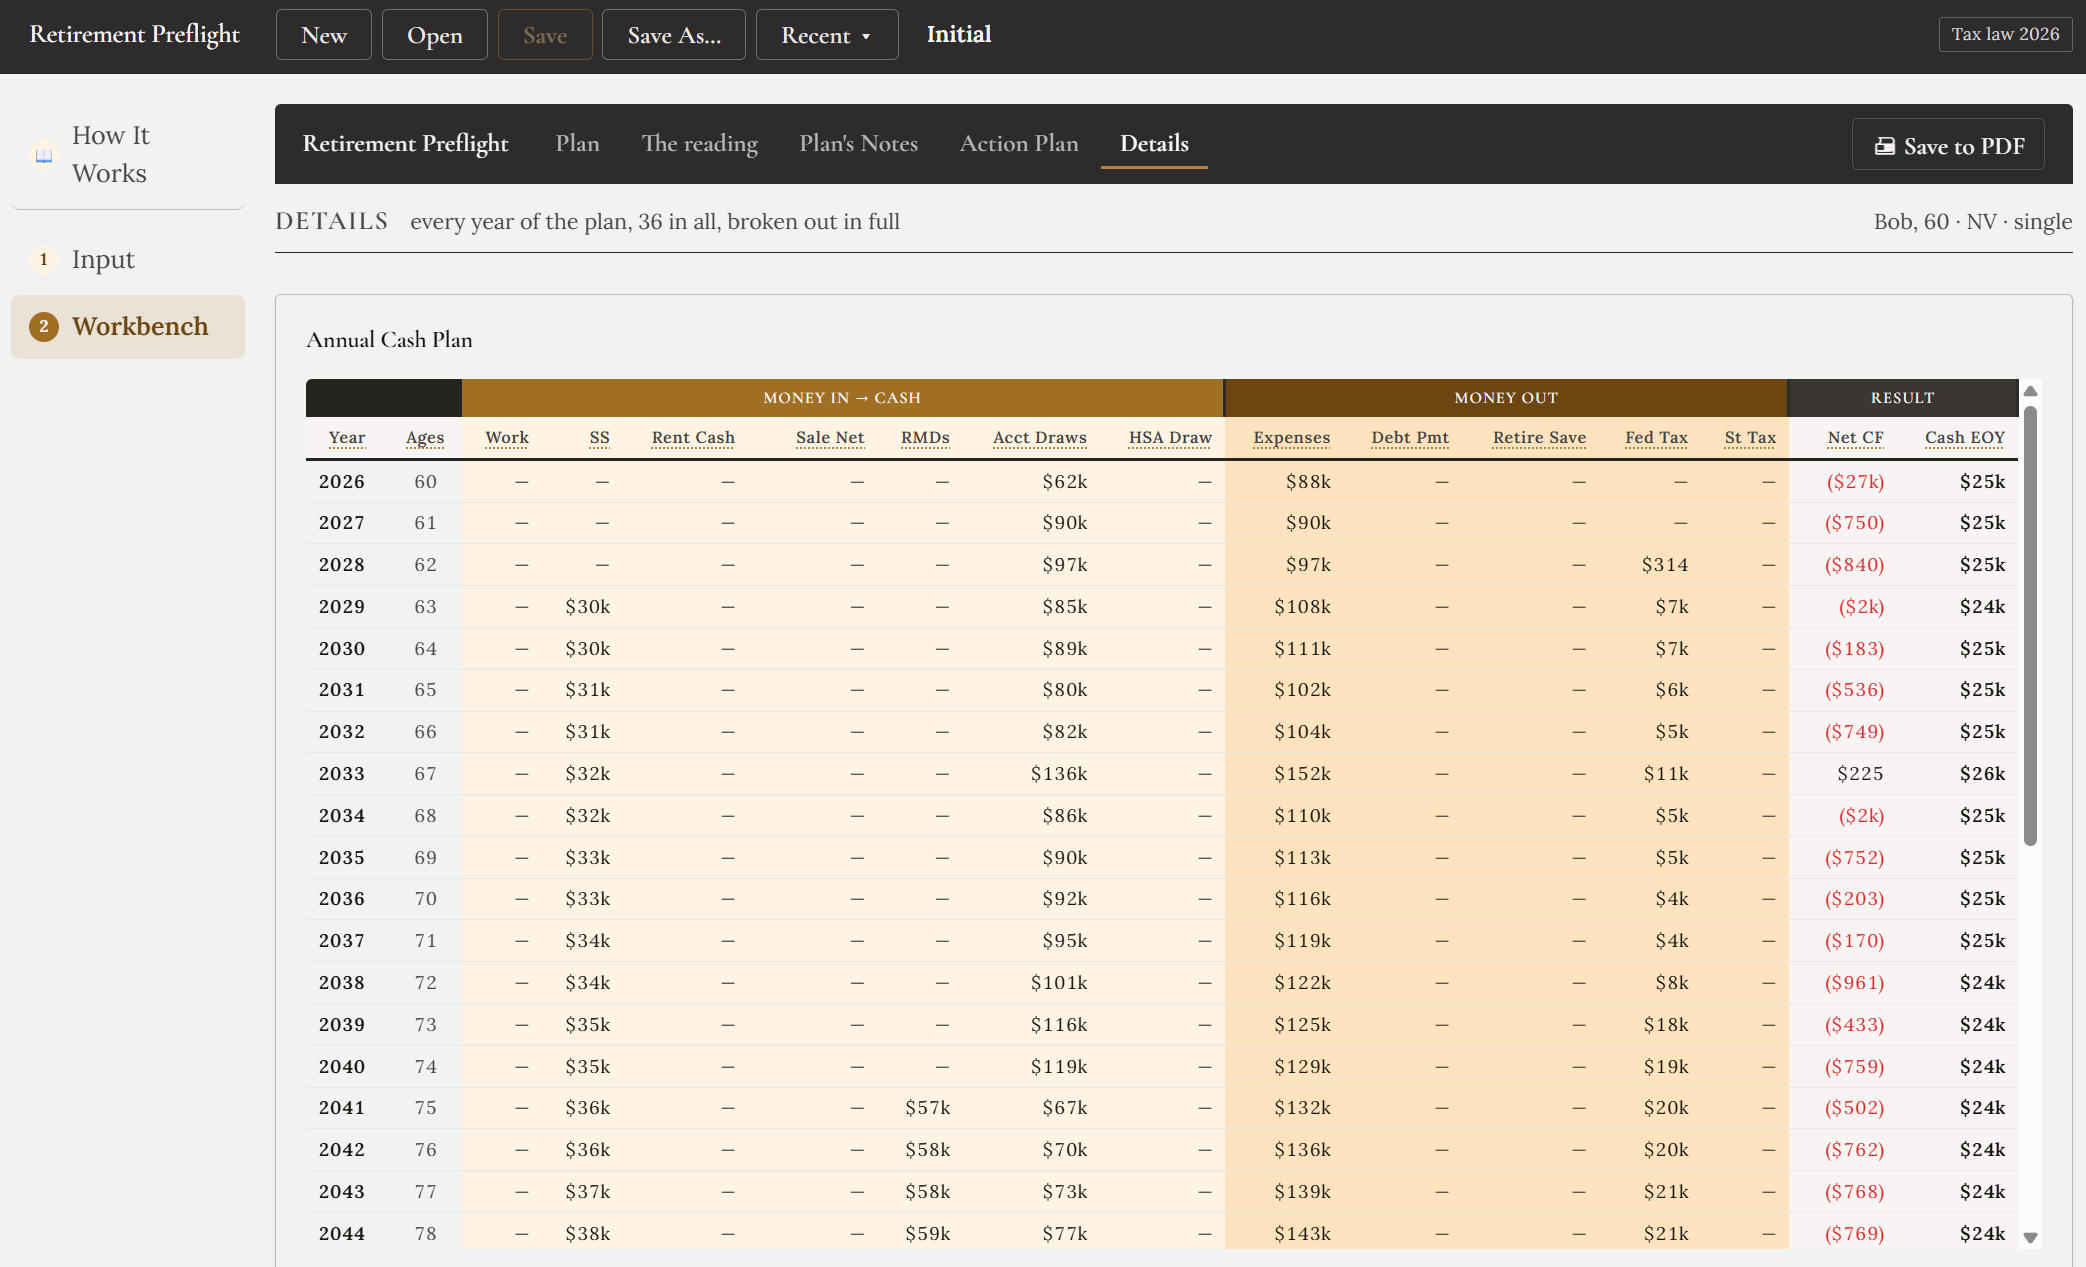
Under Details sit seven tables covering every year of the plan: the annual cash plan, account-by-account activity, conversions, ordinary income and tax, capital gains and dividends, Medicare and ACA, and a summary. Nothing is rolled up or hidden — if a figure appears anywhere in the program, the year it came from is here.
9 · Let it search
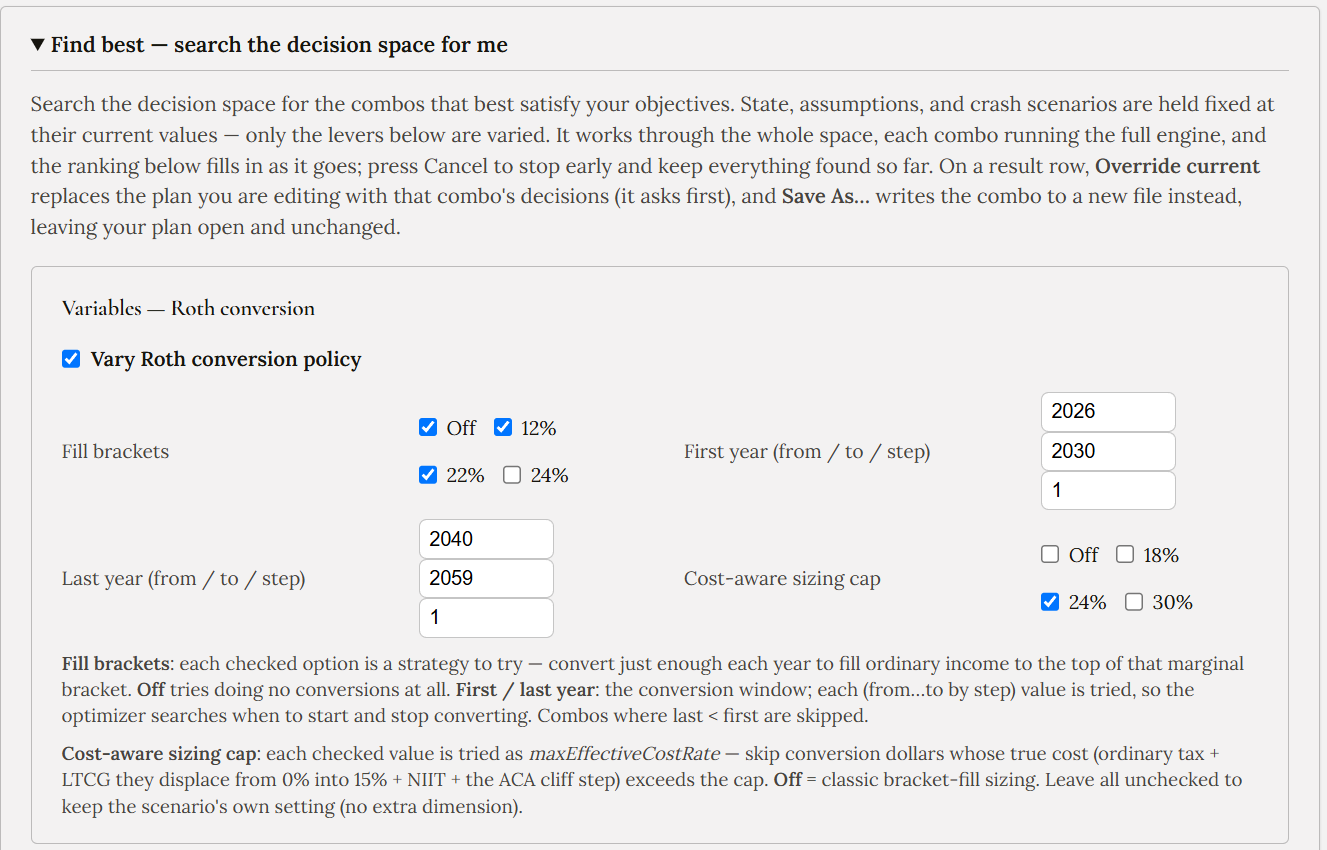
Trying one lever at a time is how you build intuition. It is not how you find the best combination, because there are more of them than anyone can work through by hand. Find Best holds your finances fixed and works through the decision space — which conversion brackets to try, which windows to start and stop in, which years to sell a property — each combination running the full engine.
You choose what it is allowed to vary. Leaving Off ticked among the brackets matters: it lets the search seriously consider doing no conversions at all, rather than assuming the answer it is looking for.
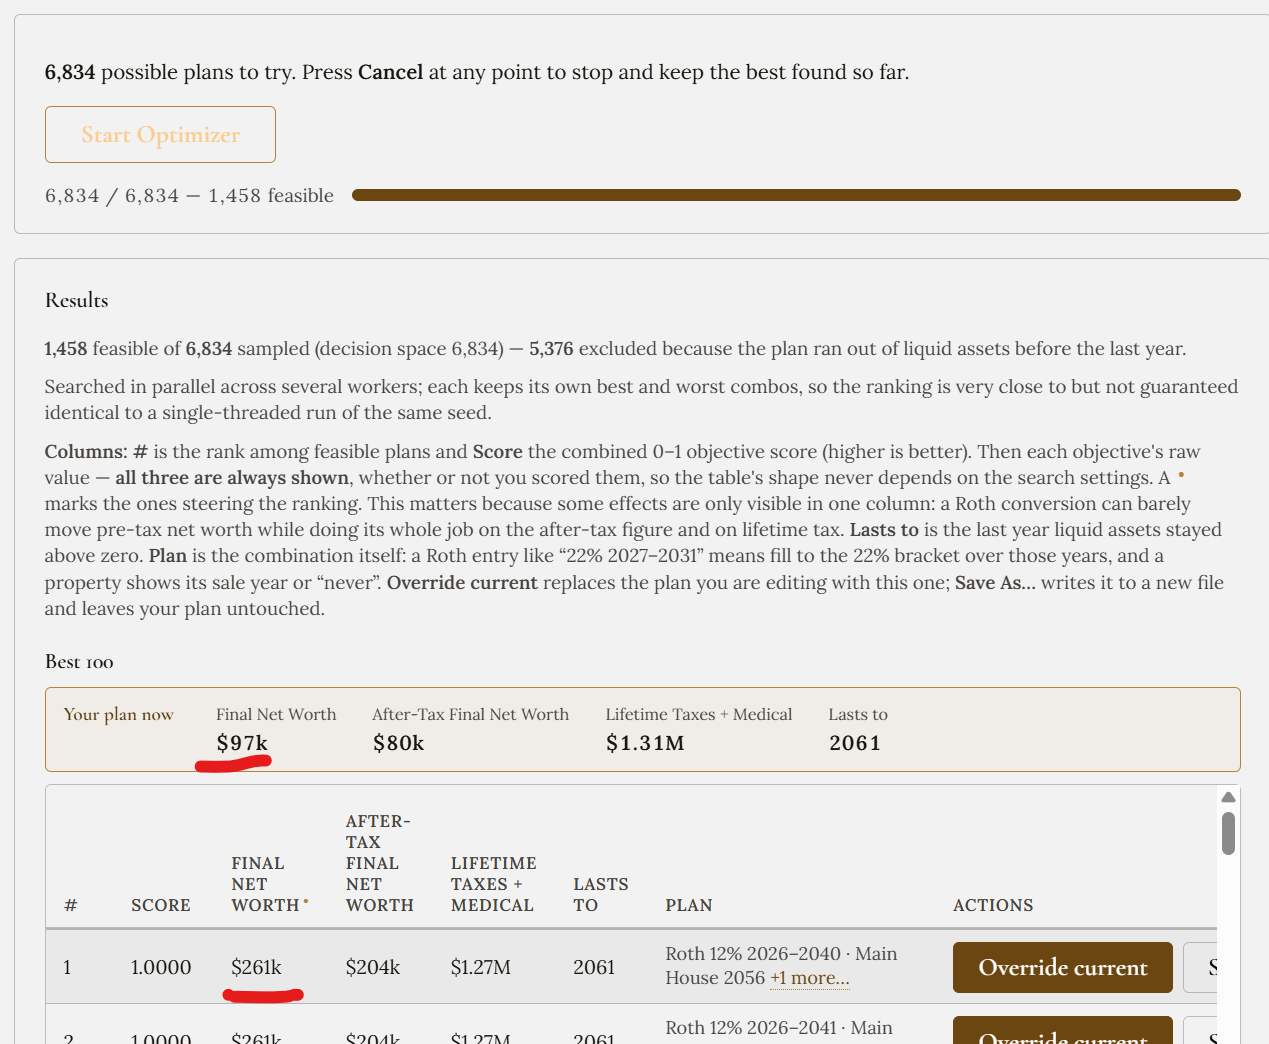
One outcome is never weighted: never running out of money is a hard constraint. A combination whose liquid assets go negative in any year is excluded outright, however good its final net worth looks. In this run that removed more than three quarters of the candidates.
10 · What it found
The best combination is the conversion policy that was sitting switched off the whole time: fill the 12% bracket from 2026 through 2040. Those empty brackets in the action plan get used, and the money moves out of the traditional IRA at a rate Bob controls instead of one the RMD rules pick for him later.
Override current applies it to the plan you are editing, after asking, and the KPI strip immediately scores the change against where you started. That is the number worth reading: after-tax final net worth rises $125,000, final net worth $164,000, and lifetime tax and medical costs fall $35,000 — on the same household, the same spending, and the same market assumptions. Only the decisions changed.
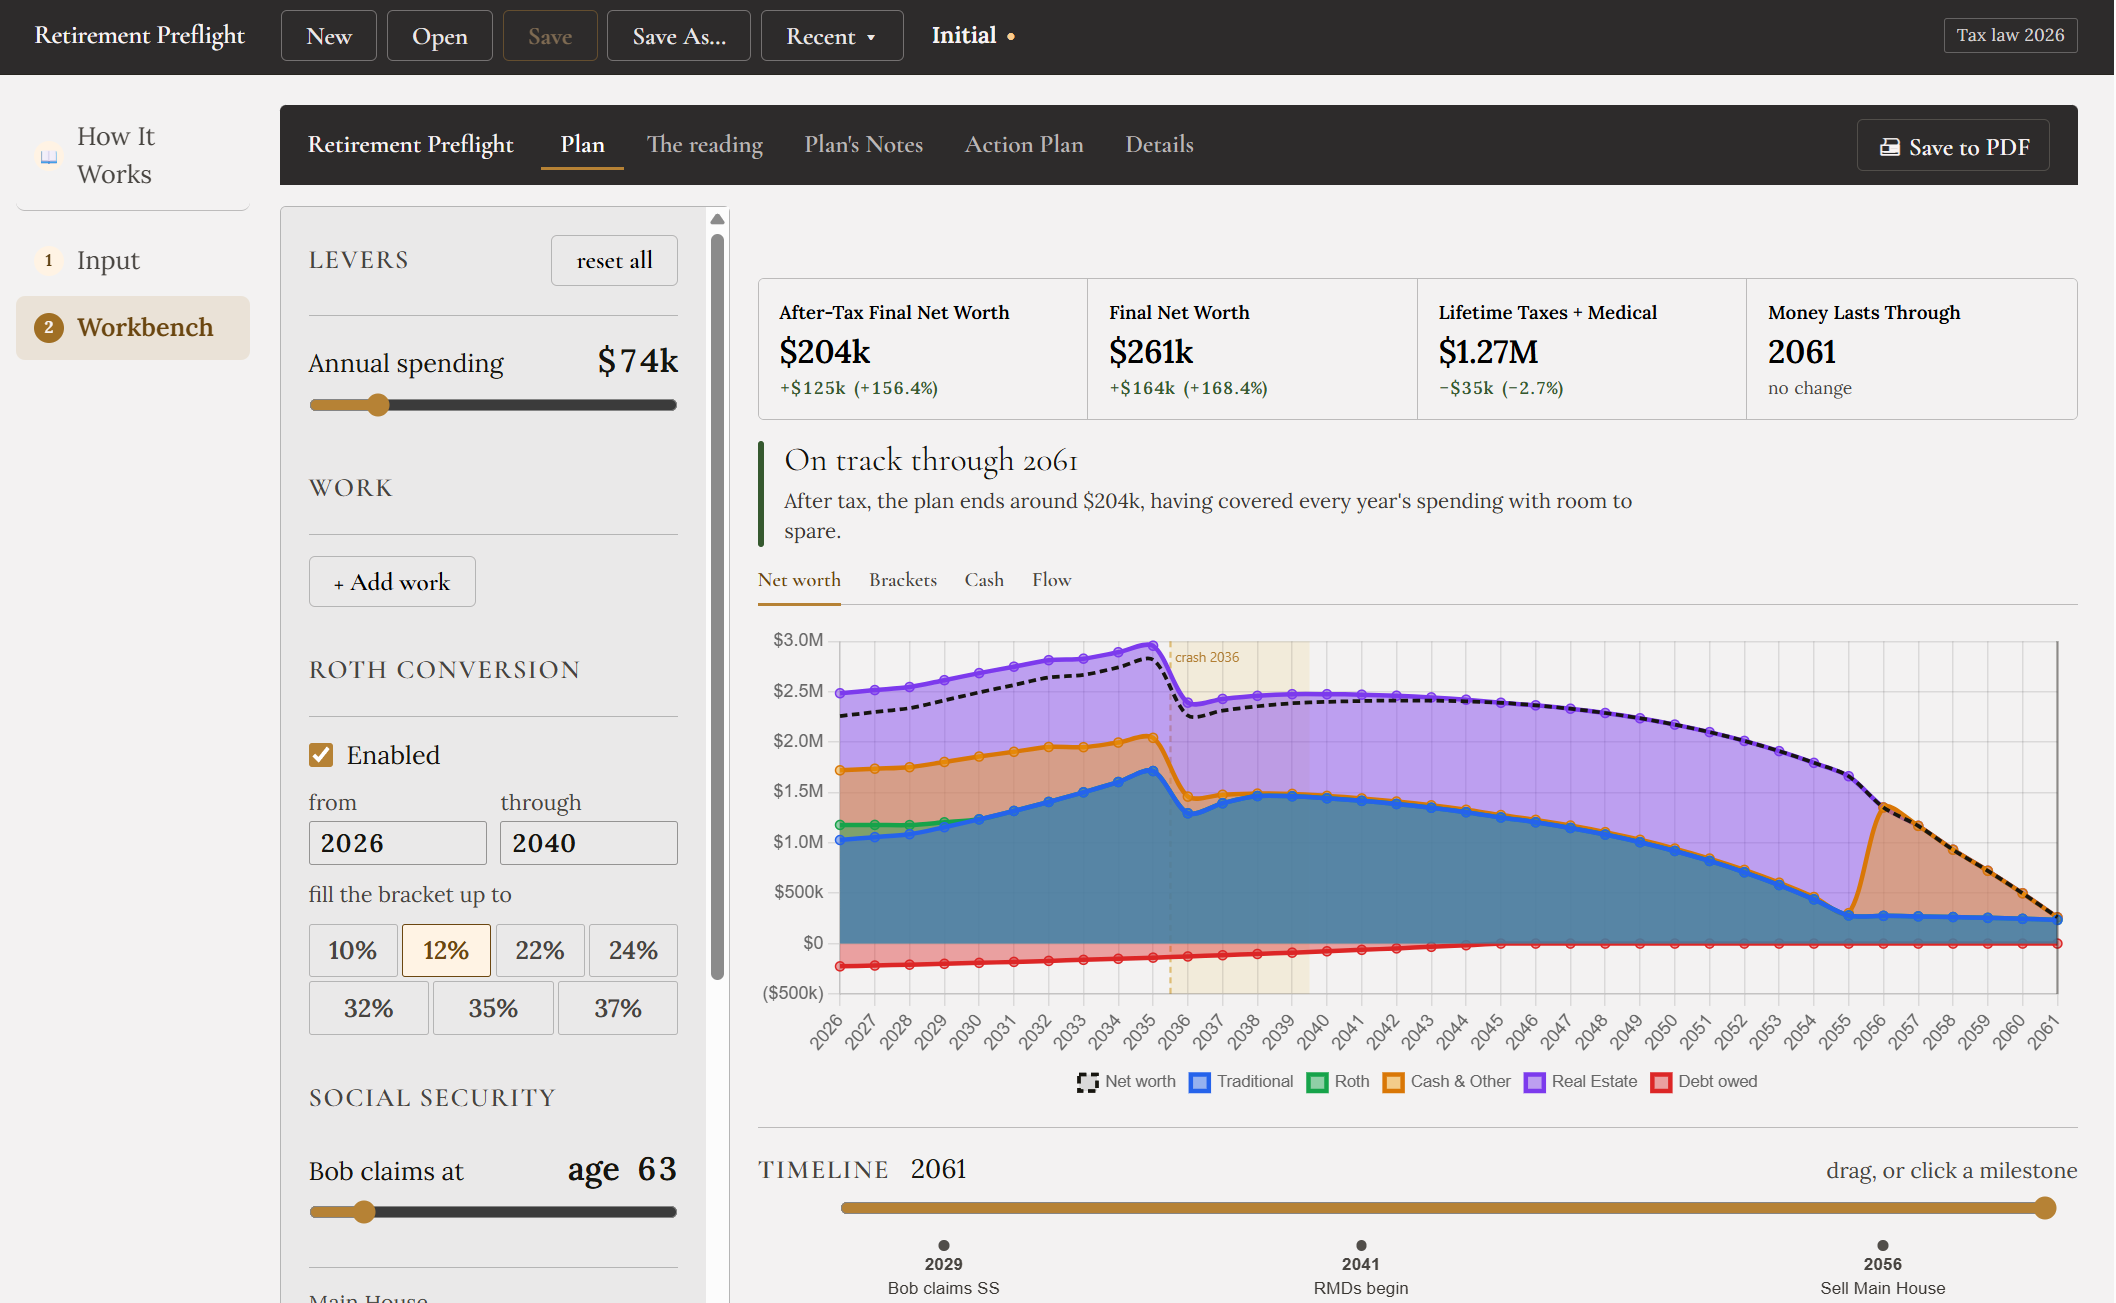
Worth noticing: the best answer was not the biggest one. Filling the 22% or 24% bracket converts more and ends up worse, because those dollars cost more than they save. That is the case for searching rather than reaching for a rule of thumb.
11 · Why it behaves that way
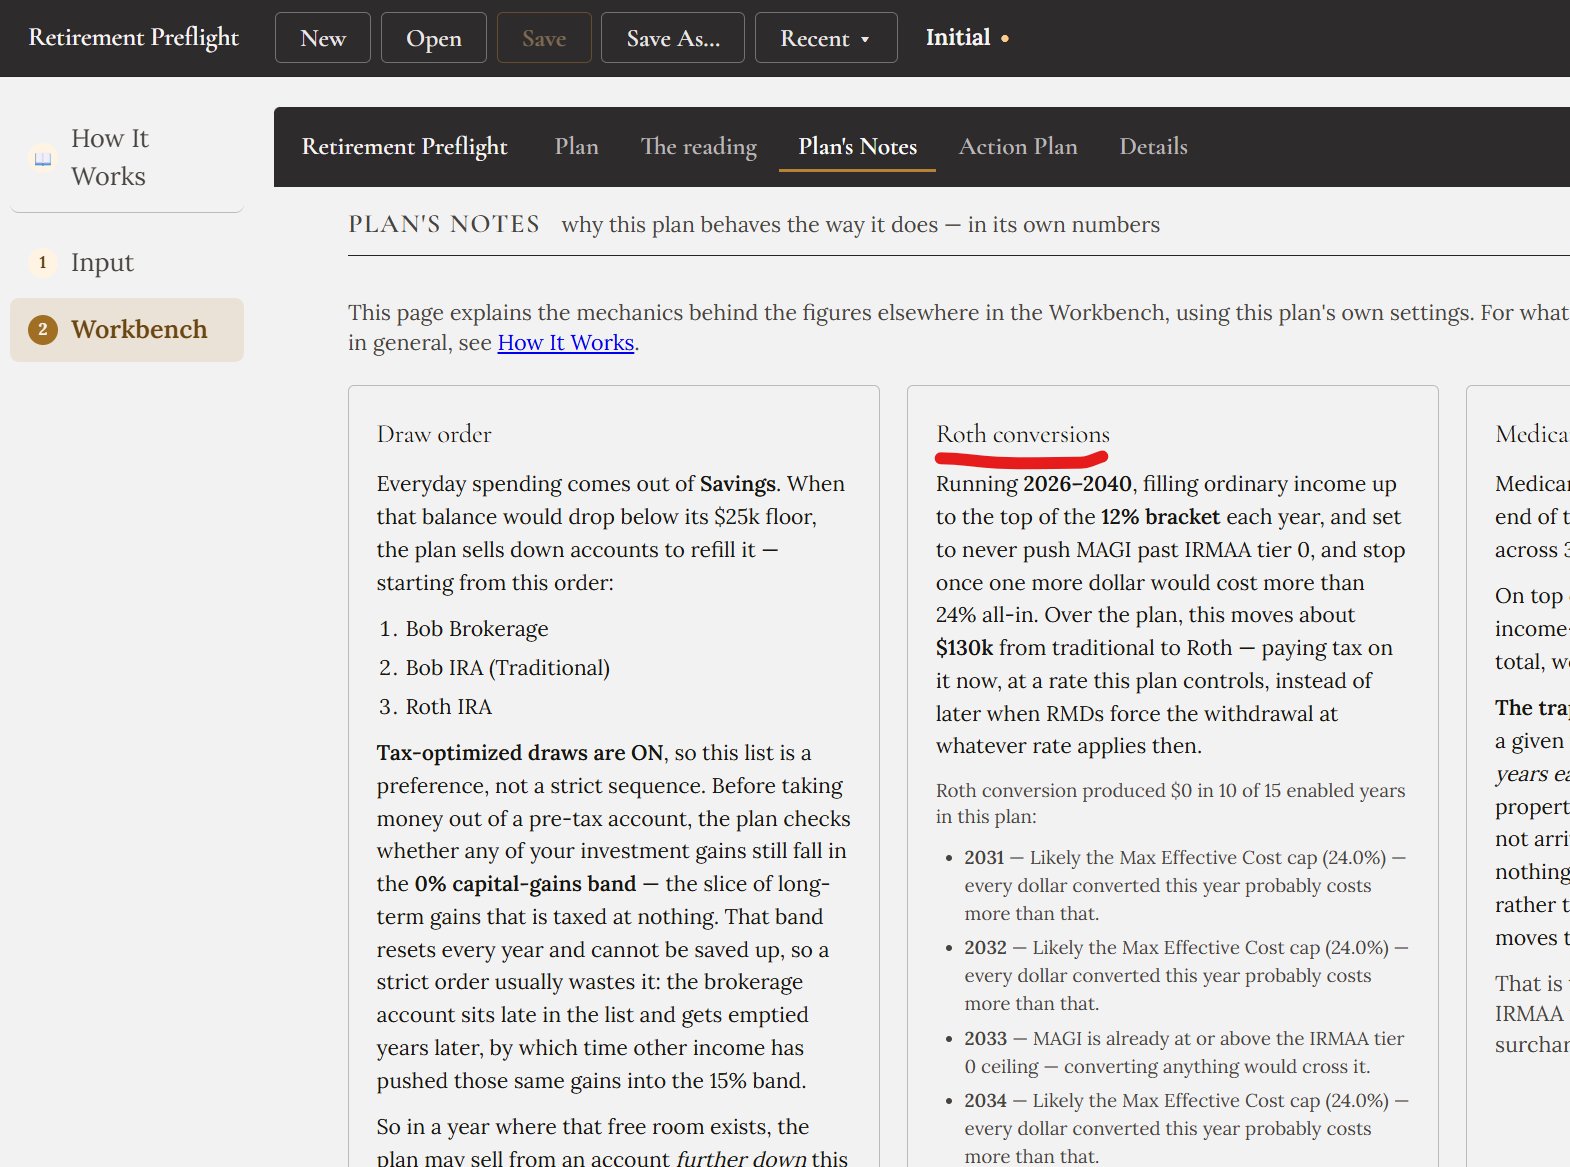
Now that a conversion policy is actually running, the obvious next question is what it is doing — and when a projection surprises you, the useful version of that question is which rule produced it. Plan's Notes answers in this plan's own numbers: what the draw order really did, how much the policy moved over its lifetime, and — most usefully — which years it converted nothing, and what stopped it each time.
Wait, there is more!
Bob's plan is a simple one, so this tour did not need everything the app can do. Here is some of what it skipped.
Earnings that have not stopped
W-2 jobs and self-employment over any range of years, with payroll and self-employment tax, the QBI and self-employed health-insurance deductions, and 401(k), IRA and HSA contributions funded from the pay.
Loans that are not mortgages
Student loans, credit cards, car loans — where the payoff date is an output rather than an input, so extra principal visibly clears the loan sooner. A mortgage stays with the property it secures.
Market crashes, two at once
Pick a severity rather than inventing a depth and a recovery length: the fall and the rebound are one shape. Run two independent downturns over the same plan to test when a bad decade would hurt most.
All 51 jurisdictions
Retirement-income exclusions with their age tiers and caps, age deductions, federal-tax deductions, exemption phase-outs and credits — resolved from the state you say you live in.
Four inflation rates, not one
Living costs, tax brackets, IRMAA thresholds and health premiums do not move together in real life, and treating them as one number understates how fast medical costs outpace everything else.
Named on screen, always
Published figures ship inside the program rather than in your file, so an old plan picks up current law by being opened. Which year that is appears in the header and on every report you print.
Everything here runs on your own machine. There is no account to create and no server to send anything to. Your plan is an ordinary file, on your own disk, that you can keep wherever you keep your documents.
Screens are from a development build and the sample plan that ships with the app; they contain no real person's financial data. Figures shown are the output of that sample, not a projection for any household and not a prediction. Retirement Preflight is a modeling tool and does not provide financial, tax, investment or legal advice.